
Deerwalk's latest release brings enhancements to the Create Module as well as expansions to viewing permissions for tracking specific segments of your population

Below are the key highlights from this month’s release of Deerwalk Plan Analytics:
- Create Module: Interface Enhancements & New Data Visualizations
- Expansion of Cohort Sharing Functionality
- New Deerwalk Episodes for COVID-19 & Related Elective Surgery Utilization
- 2020 Benchmark Updates
1. Create Module: Interface Enhancements & New Data Visualizations
We've made multiple updates to the Create Module, which is a tool that allows you to generate custom dashboards, charts, tables, and widgets.
- We've incorporated dynamic formatting to optimize data labels for spacing considerations, e.g., a data point that was previously displayed as "$23,308,198.59" would now be represented as "$2.3M."
- To give you and your clients more information and context as you navigate through the module, we've added descriptions that appear when you hover over the titles of charts, tables, and dashboards.
- We've given a facelift to the "Create Tables" section of the module with a new, simple interface that mimics the existing functionality of other tools within the application (such as "Create Charts"). Create Tables allows you to build custom tables and preview results in real time, giving you instant feedback as you select and adjust your report parameters (such as population and date filters, data type, and "summarize by" fields). You now also have the option to expand your window panel size for easier viewing of large tables.
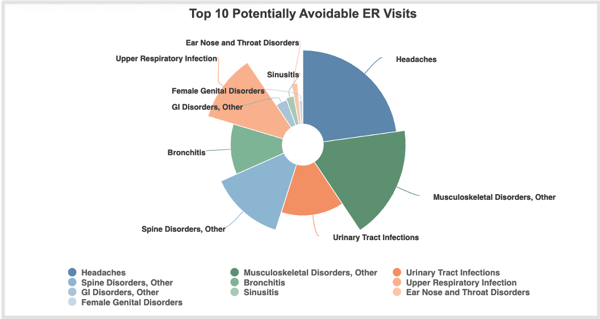
- In the Create Charts section of the module, we've added three visualization options to give you new ways to illustrate your data. These additions include:
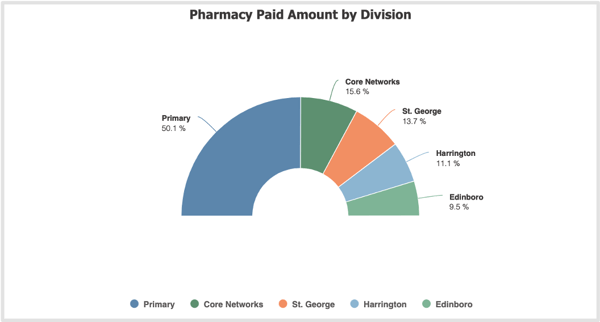
2. Variable radius pie - can be helpful when visualizing two different parameters in a pie chart format (e.g., quality versus risk).
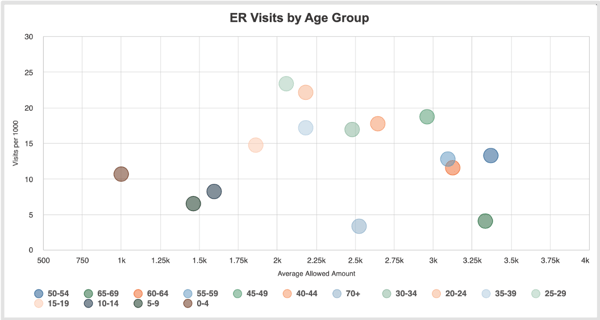
3. Scatter plot - can be used when trying to identify the relationship between two different parameters (e.g., risk and cost).
2. Expansion of Cohort Sharing Functionality
Deerwalk's cohort creation functionality allows you to track population segments by whatever filters you select (e.g., you can build a cohort to track members with diabetes who aren't meeting certain quality metrics). In response to client feedback, we've added flexibility that lets you share cohorts with users who have varying levels of access (e.g., users who have access to view specific groups but not all groups). Administrative users can choose to turn cohort sharing on or off for specific user tiers.
3. New Deerwalk Episodes for COVID-19 & Related Elective Surgery Utilization
Deerwalk Episodes is designed to help you measure the impact of bundled payments on the cost and utilization of services for your population and to compare providers for certain procedures. We've added new episodes so you can track events and costs related to COVID-19. Beyond COVID-19 diagnoses, this includes episodes for select elective surgeries to allow for reporting on procedures that have potentially been delayed due to COVID-19, which we will further expand upon in the near future. (Please note that the list of episodes is populated dynamically based off each client's claims data so certain episodes may not appear if there is no occurrence of that episode in your data).
New episodes:- Cataract extraction
- COVID-19
- Cystoscopy
- Hysteroscopy
- Inguinal herniorrhaphy
- Myringoplasty/tympanoplasty
- Myringotomy
- Septoplasty
- Varicose vein stripping and ligation
4. 2020 Benchmark Updates
Deerwalk enriches your data with over 1,000 benchmark metrics (based off five million members) that are included in various standard reports and can also be integrated into custom reports as desired. The benchmark metrics are updated twice annually and have now been updated with the latest data available. For most clients, this includes data incurred through June 2019 and paid through December 2019.
Schedule a demo to learn more about how to use Deerwalk Plan Analytics and the latest features.

Subscribe to our blog or follow us on Facebook, Twitter or LinkedIn to join the conversation.