
Deerwalk's latest release brings the ability to create and save report versions, create thousands of custom widgets, and more
Below are the key highlights from this month’s release of Deerwalk Plan Analytics:
- REPORT VERSIONING
- NEW CREATE WIDGET ICONS
- REPORT UX/UI ENHANCEMENTS
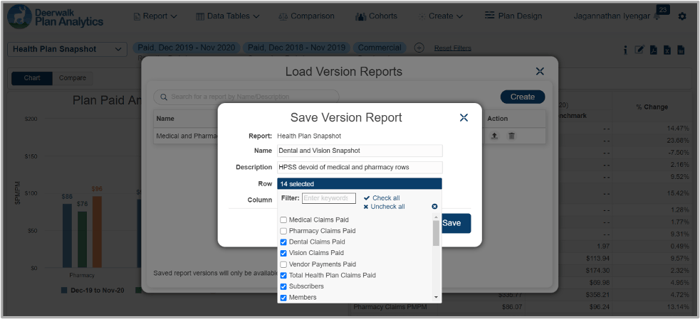
1. REPORT VERSIONING
With this release of Deerwalk Plan Analytics, you now have the ability to create and save report versions by selecting desired rows and columns from that report. You can select as many rows and columns from the original report as you want to include in your report version.
Report Library Administrators also have the option to publish report versions to the Report Manager. Once a report is successfully published to the Report Manager, it will retain the same functionality as any other individual published report. The report export will reflect the name of the saved report version.
One use case for report versioning would be to create a subset of the Quality Metrics report with select metrics. For example, you may want one report version with only asthma-related metrics and another with only wellness-related metrics. Another use case would be to create versions of the Provider Cost Aggregation report with different metric types (ER Visits, Urgent Care Visits, Routine Office Visits, etc.) and make them available for export from the Report Manager.
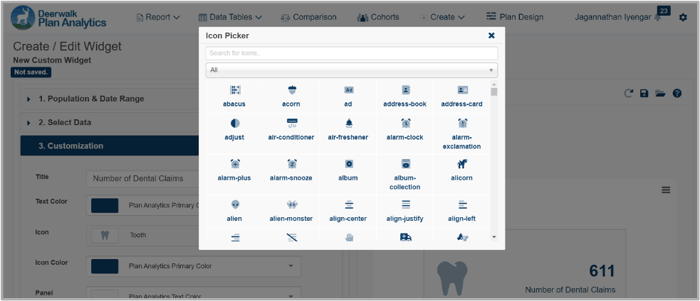
2. NEW CREATE WIDGET ICONS
We're always working on enhancing the Create Module, a tool that allows you to build custom reporting and dashboards, including dashboard elements (charts, tables, and widgets). With this release, you now have a library of over 3,200 icons to choose from, enabling you to create widgets that better illustrate your data insights.
3. REPORT UX/UI ENHANCEMENTS
Continuing our phased application redesign, we've updated certain elements (such as the population selection window) and individual population filters to improve the overall look-and-feel as well as the usability of the Deerwalk standard reports. As part of these enhancements, you'll also notice the option to select from quick date ranges, making it faster and easier to choose common reporting and comparison periods.
Schedule a demo to learn more about how to use Deerwalk Plan Analytics and the latest features.

Subscribe to our blog or follow us on Facebook, Twitter or LinkedIn to join the conversation.