
.jpg?width=1200&name=iStock-682315328%20(1).jpg) Deerwalk's latest release of Plan Analytics includes new reporting and filtering functionality to support the delivery of high-value care
Deerwalk's latest release of Plan Analytics includes new reporting and filtering functionality to support the delivery of high-value care
Deerwalk’s agile software development has allowed us to incorporate some exciting enhancements to this month’s release of Plan Analytics, the flagship population health analytics and reporting application. Some new features of Plan Analytics version 8.7 include:
- Hospital Cost & Quality Reporting
- Hospital Cost & Quality Filtering
- Clinical Reporting Update
- Template Manager Updates and Additions
- Updated Benchmarks
1. Hospital Cost & Quality Reporting
Five new reports are being made available for clients who purchase Provider Quality data via our partner, Quantros. An additional two reports are available for clients who purchase Medicare Reference Based Pricing in addition to Provider Quality. These reports join provider quality data from Quantros with a client’s medical claims to allow you to quickly identify high quality, low cost hospitals.
| Clinical Category Quality Summary | Plots in a quadrant graph a population's hospital claims vs. each of the Quantros clinical categories. |
| Clinical Cost and Quality* | Plots in a quadrant graph a population's hospital claims as a percentage of Medicare vs. each of the Quantros clinical categories. |
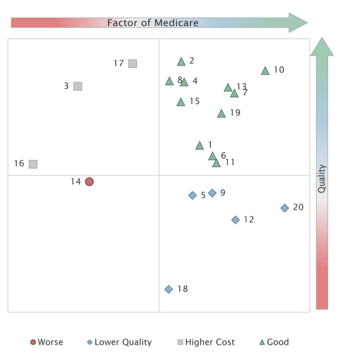
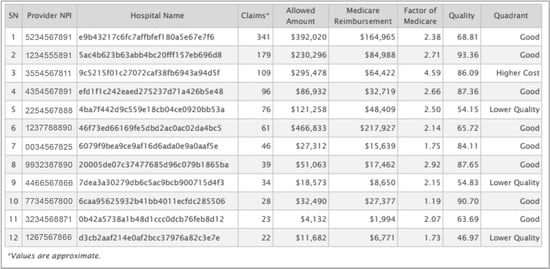
| Hospital Cost and Quality* (see sample screenshots below) | Plots in a quadrant graph a population's hospital claims as a percentage of Medicare vs. the overall quality of that hospital. |
| Hospital Usage and Quality | Plots in a quadrant graph a population's hospital spend vs. the overall quality of that hospital. |
| Population Cost and Quality | Allows selected populations from Levels of Aggregation to be compared, displaying cost, risk score, and hospital quality in a table and quadrant graph. |
| Hospital Quality: Complications | Surfaces the cost implications of utilizing hospitals based on the Quantros Risk-Adjusted Complication Index. |
| Hospital Quality: Readmissions | Surfaces the cost implications of utilizing hospitals based on the Quantros Risk-Adjusted Readmissions Index. |
*Reports only available with Medicare Reference Based Pricing
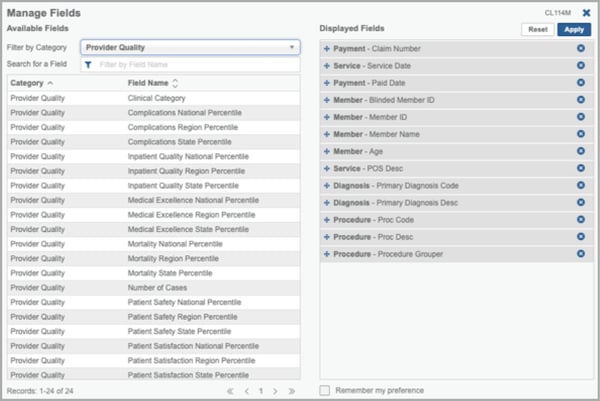
2. Hospital Cost & Quality Filtering
In addition to generating reports using the provider quality data, you can also query the database directly through the Data Search module. Twenty-four additional fields relating to this data are now available in Medical Data Search, allowing you to create your own filters using the Quantros quality data.
3. Clinical Reporting Update
The clinical content of the reports under Reports > Clinical has been updated. This concludes the annual clinical update that began last month with the Quality Metrics refresh.
- In the Selected Procedures Report, nine of the procedures were updated with new HCPCS, CPT and ICD-10 procedure codes released for 2019.
- In the Potentially Avoidable Admissions Report, nine of the diagnoses had additional exclusion codes added. Four diagnoses had new codes added and one diagnosis had some of the trigger codes used to identify the condition removed.
- The Readmission Report had new CPT and ICD-10 codes released for 2019 added for two categories.
- In the Potentially Avoidable ER Visit Report, five of the diagnoses had new ICD-10 diagnosis codes released for 2019 added.
4. Template Manager Updates and Additions
Template Manager allows clients to create their own reports using the data in Plan Analytics. The data from the seven new reports are now available to be utilized in Template Manager.
Some additional functionality changes have been made within Template Manager: (1) clients can now select certain templates to mark as “Favorites” and (2) there is now the ability to filter by those reports that have been labeled “Shared.’
5. Updated Benchmarks
The annual update to the Deerwalk national normative benchmark data set has been completed. The data set now includes 4.1 million member lives. During a query the benchmarks are dynamically adjusted, which means that the benchmark values automatically adjust based on the age and gender mix of the population.
Looking ahead: In version 8.8, Deerwalk will be unveiling our new Plan Modeling tool.
Customers seeking more information on recent releases should contact their account managers.
Schedule a demo to learn more about how to use Deerwalk Plan Analytics and the latest features.

Subscribe to our blog or follow us on Facebook, Twitter or LinkedIn to join the conversation.