
Deerwalk's latest release of Plan Analytics brings enhanced dashboard customization and simplified document management

This month’s release of Deerwalk Plan Analytics, the flagship population health analytics and reporting application, incorporates several new and updated features in version 9.0:
- Create Dashboards
- Report Archive Enhancements
- Document Repository
- Security Update
- Metrics Updates
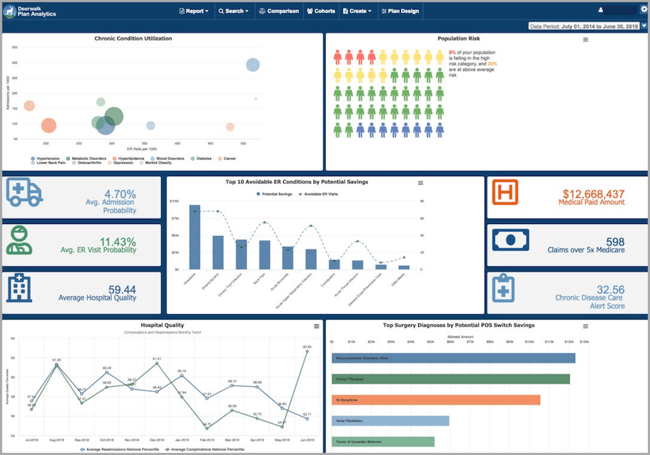
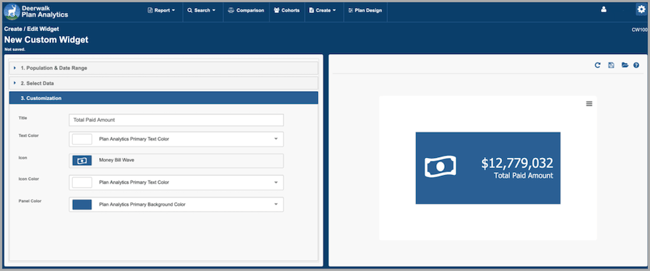
1. NEW! Create Dashboards
With this most recent addition to the "Create" module, we've refactored our existing dashboards to give you complete freedom in what you choose to present to clients, stakeholders, or decision-makers. Using a drag and drop editor, you can now mix and match multiple modular elements, including custom or out-of-the-box charts, tables, and graphics to build dynamic dashboard views. You can generate your own widgets (small pictographic tiles) to highlight meaningful data points or insights. Widgets can be configured using icons, color-branded, and incorporated into the dashboards.
These dashboards retain Deerwalk's signature interactive functionality that allows for drill down to the claim-line or member-level detail and can be run for specific populations/data sets with just a few clicks. Once you've built out the dashboard(s) to your liking, they can be...
- Set as the default view for yourself or for your entire team.
- Exported to PDF or Word.
- Saved to a dashboard repository for future use.
- Published to Deerwalk Executive Analytics for easy sharing with stakeholders.
You can build digitally-appealing dashboards that can be leveraged to...
- Keep an eye on high-risk populations by tracking progress and managing enrollment and participation in programs.
- Monitor employee/member health outcomes and benefits utilization.
- Push high-level financial/operational metrics and successful outcomes to clients/decision-makers via Executive Analytics.
- Call out and monitor unnecessary spending by tracking areas such as claims paid for ineligible members, avoidable utilization, etc.
- Identify and drill down on actionable savings opportunities.
- Stay on top of non-compliant members or those with high risk scores by setting up risk flares to alert you to changes in member demographics or health status, allowing for early intervention and prevention.
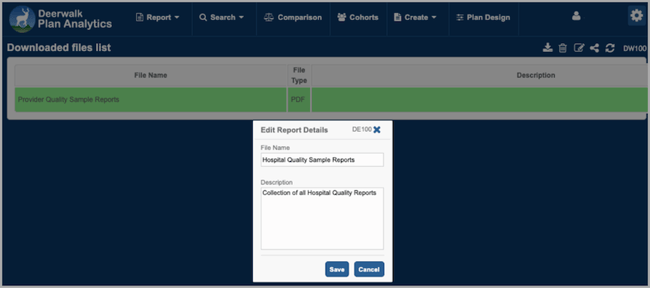
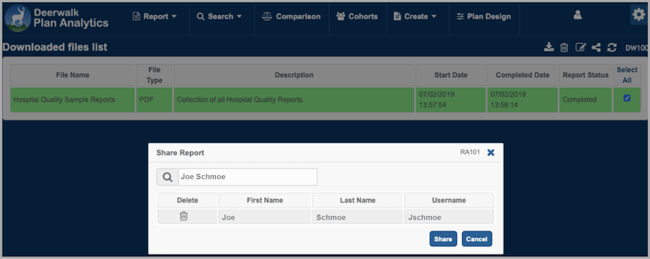
2. Report Archive Enhancements
The "Report Archive" now allows you to rename files and label them with descriptions, making it easier to identify and run previously generated reports for future use. Depending on who needs visibility, you are able to push these reports out to your entire team or specific users.
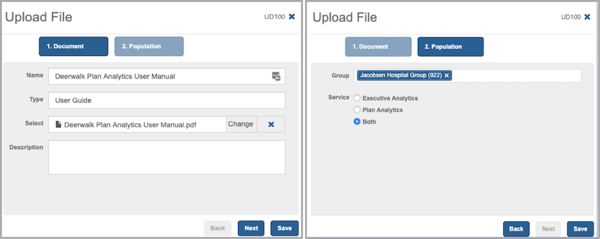
3. NEW! Document Repository
The "Document Repository" makes it easy for you to manage and share documentation with your team and/or stakeholders. It serves as a central hub where you can upload reference documents such as product/user guides, training materials, or release notes and make them available for download or distribute them securely. You can publish documents directly from Plan Analytics to Executive Analytics and selectively send group-specific documents only to those vested parties.
4. Security Update
Keeping your data secure is a top priority and we are constantly looking for ways to further strengthen our multi-layered approach to security. With this release, we have implemented geolocation security filtering to help prevent security incidents such as Distributed Denial of Service (DDoS) attacks and mass brute force login attempts. This filtering blocks all incoming traffic to the Deerwalk platform from locations outside of the United States unless we explicitly grant access.
5. Metrics Updates
We currently have a total of 114 quality measures/risk triggers in Plan Analytics. Two new Quality Metrics have been released with version 9.0.
- W40 - Women ages 50 to 75 with a screening mammogram in the last 24 months: Quality sources differ in the recommended age to start screening mammograms—some say to begin screening at 40 years old and others say to begin at age 50. We now include both metrics so you can assess your population on whichever basis you see fit.
- W41 - Colorectal cancer screening ages 50 to 75: This new metric helps to identify that the appropriate colorectal cancer screening has been done in accordance with national quality standards. Up to 10 years of history can be looked at if it is available and is necessary.
As a significant portion of healthcare dollars are spent on inpatient costs, Plan Analytics provides insight into changes in the healthcare trend by allowing you to analyze results for reporting and comparison periods for key utilization metrics. We regularly make updates to our Utilization Metrics. With this release, we've enhanced accuracy in the counting of Dates of Service for Emergency Room (ER) visits.
Customers seeking more information on recent releases should contact their account managers.
Schedule a demo to learn more about how to use Deerwalk Plan Analytics and the latest features.

Subscribe to our blog or follow us on Facebook, Twitter or LinkedIn to join the conversation.