
Deerwalk's latest release brings new disease-specific chronic condition reporting, machine learning models that indicate the likelihood of disease, and more

In this release, we've introduced new chronic condition reporting, expanded our use of artificial intelligence to incorporate new machine learning models, added features to enable further customization of report bundles, and more. Below are the key highlights from this month’s release of Deerwalk Plan Analytics:
- Disease-Specific Chronic Conditions Reporting
- New Machine Learning Models
- Additional Reporting and Create Module Enhancements
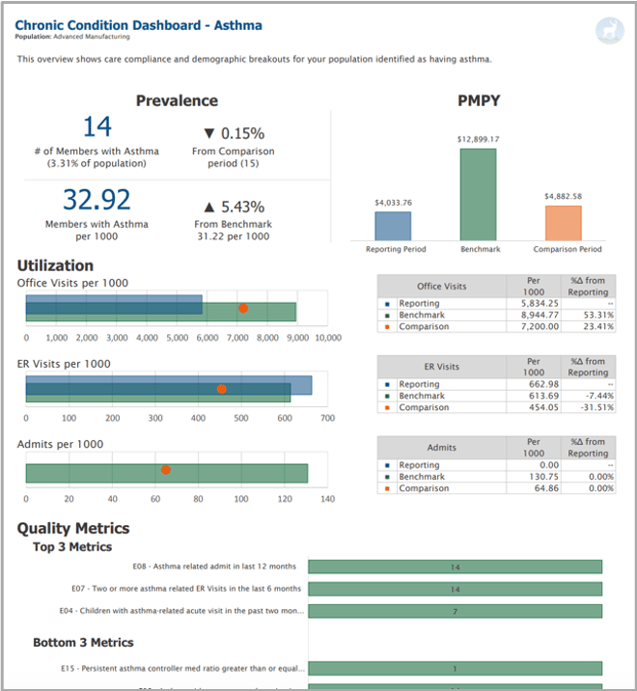
1. Disease-Specific Chronic Conditions
Reporting on nine new disease-specific chronic conditions is now available from Plan Analytics Report Manager. At a glance, you can see the most relevant KPI for each specific chronic condition. A dashboard view displays the cost, prevalence, utilization, and care compliance to provide an overall picture from within a single report (see example for "Asthma" below).
Reports are available for the following conditions:
- Asthma
- CAD
- CHF
- Chronic Pain
- COPD
- Depression
- Diabetes
- Hyperlipidemia
- Hypertension
2. New Machine Learning Models
In Plan Analytics v9.4, Deerwalk introduced our first machine learning model, which utilizes artificial intelligence to identify potential diabetics. Using artificial neural networks, a patient’s medical, pharmacy, and eligibility history are fed into the model and transformed into a set of several thousand member-level features that enable the system to return a score that indicates the likelihood a member has diabetes.
In Plan Analytics v9.7, we've rolled out machine learning models that identify members who may have other common undiagnosed chronic conditions, including coronary artery disease (CAD), congestive heart failure (CHF), or chronic obstructive pulmonary disease (COPD). Each member is assigned a confidence score from “zero” to "one," indicating the minimum likelihood a member has the condition to the maximum likelihood a member has the condition, respectively. You can easily identify those that likely have the condition(s) via our Member Search tool.
3. Additional Reporting and Create Module Enhancements
- Custom Report Breaks: Deerwalk reporting and scheduling can be conducted using the Report Manager tool. You can bundle and schedule reports and designate which clients or stakeholders you'd like to have access to specific reports. We're always updating our report functionality to add new options and improve flexibility. In this release, we've added the ability to insert custom page breaks in report bundles. From within Report Manager, you can now add custom content into page breaks between reports. You can choose to create introductions, section breaks, or glossaries in an .XLSX file, upload them using an “Upload Report Content” button, and insert them wherever you desire. This new capability allows you to more fully customize the look and feel of your report bundles or include content that’s relevant or unique for specific reports or clients.
- Summarize Member Lists in the Create Module: The Create module allows you to create and share dynamic dashboard views using multiple graphical elements, including charts, tables, and custom widgets. As we're continually working to improve the Create module, we've now added the ability to use individual member data to create member-centric tables, charts, and dashboards that can display record counts and averages for risk scores, paid amounts, and other member-specific data elements.
Schedule a demo to learn more about how to use Deerwalk Plan Analytics and the latest features.

Subscribe to our blog or follow us on Facebook, Twitter or LinkedIn to join the conversation.