
As part of our agile approach to software development, the Deerwalk team is dedicated to bringing new efficiencies and innovation to our clients that improve the usability and functionality of our healthcare analytics solutions. We are proud to announce enhanced features of Plan Analytics, the flagship population health analytics and reporting application released in December 2018 and January 2019.
Recent updates include enhancements to Provider Quality Data, updated branding options, and a number of design improvements to various parts of the application, including the “Show/Hide Fields” cogwheel used for data searches and the “Reports” menu.
Provider Quality
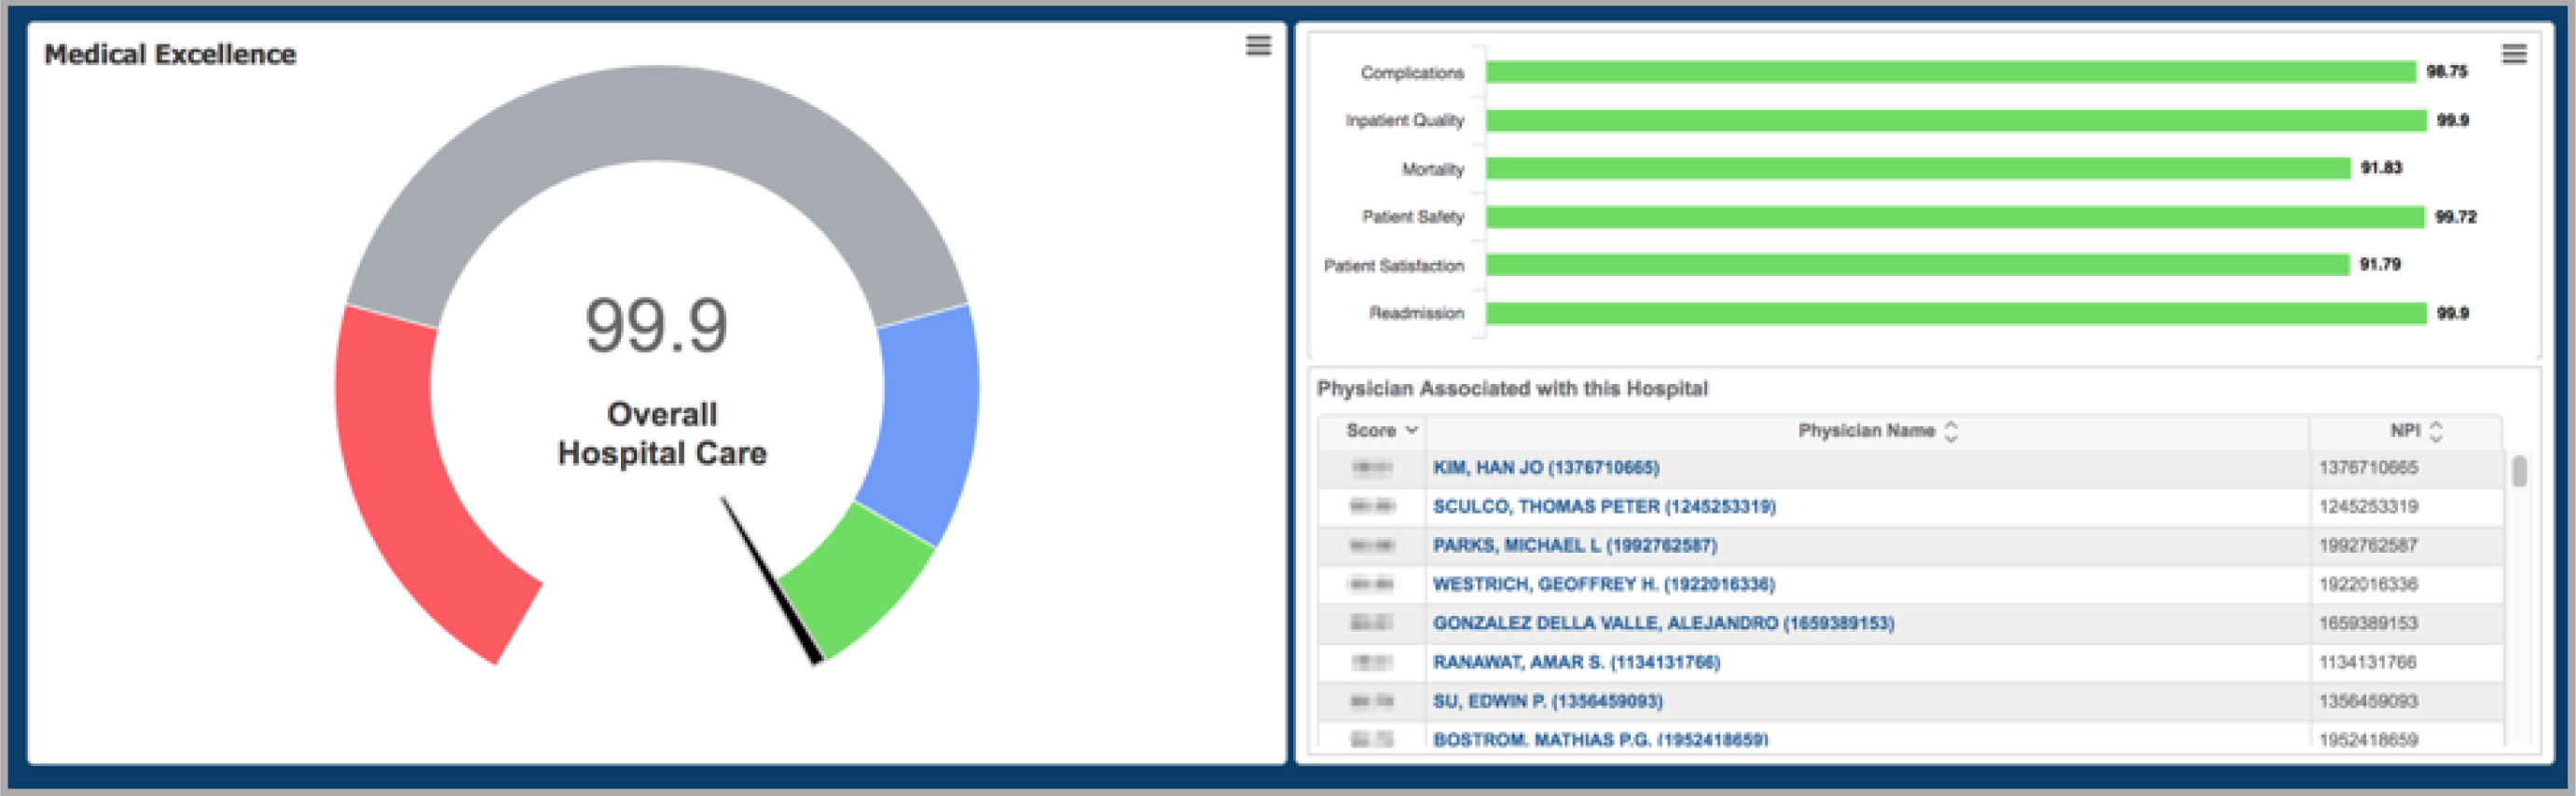
The Quantros CareChex Quality Rating System launched in November of 2018. It is integrated within Plan Analytics and available as a buy-up option. This functionality allows you to search, filter, and view provider quality ratings for inpatient procedures using data sourced from CMS. Physician, hospital, and physician-hospital affiliation data is available along with provider-specific drill-down screens and Excel export functionality.
In this release, you can now (1) drill down from hospitals directly to physicians associated with those hospitals and (2) access a list of hospitals associated with a specific physician from a tabular view within the “Physician Summary.”
Branding Options
We’ve enhanced the branding options with updated pages that allow you to customize branding for different parts of the application. This user-friendly branding package can be purchased as a buy-up to Plan Analytics and/or Executive Analytics. There are separate pages to access report branding, application branding, group-specific branding, and login page branding.
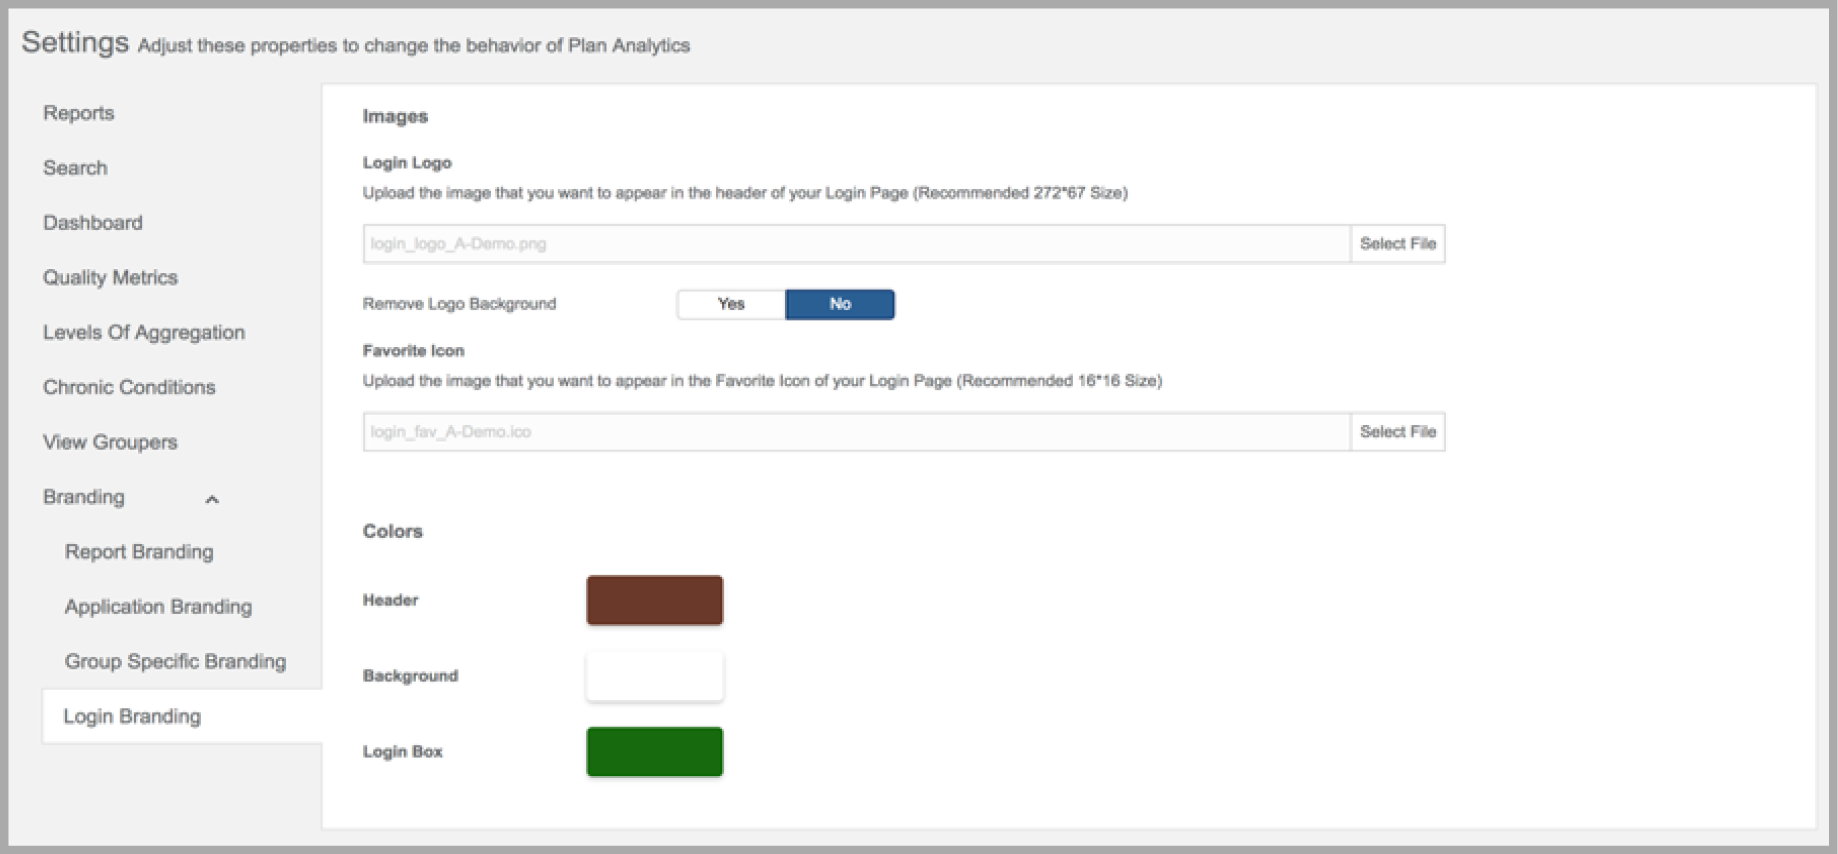
To streamline the branding setup process for the application login page, we’ve created a “Login Branding” page with straightforward configuration settings for color schemes and logo selection.
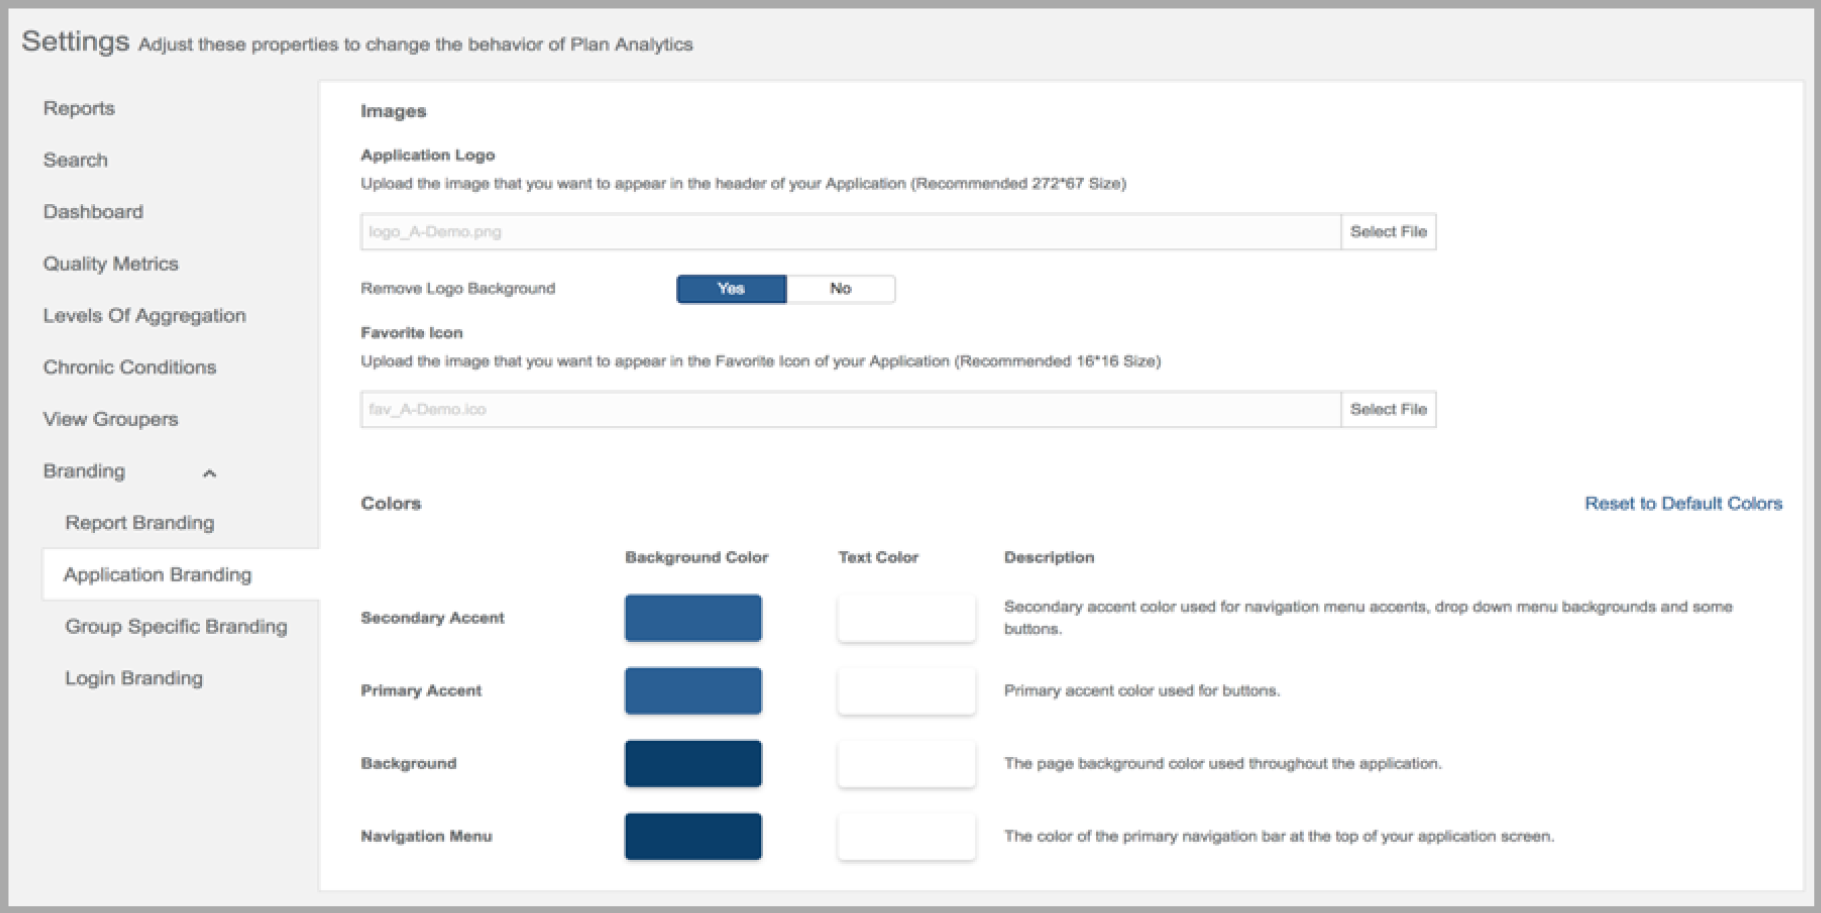
We’ve also updated the “Application Branding” page, where clients can quickly upload logo files and input custom color codes to be displayed throughout the entire application. To simplify color scheme adjustments, we’ve added instructional text that indicates where each color maps to within the application.
“Show/Hide Fields” Option
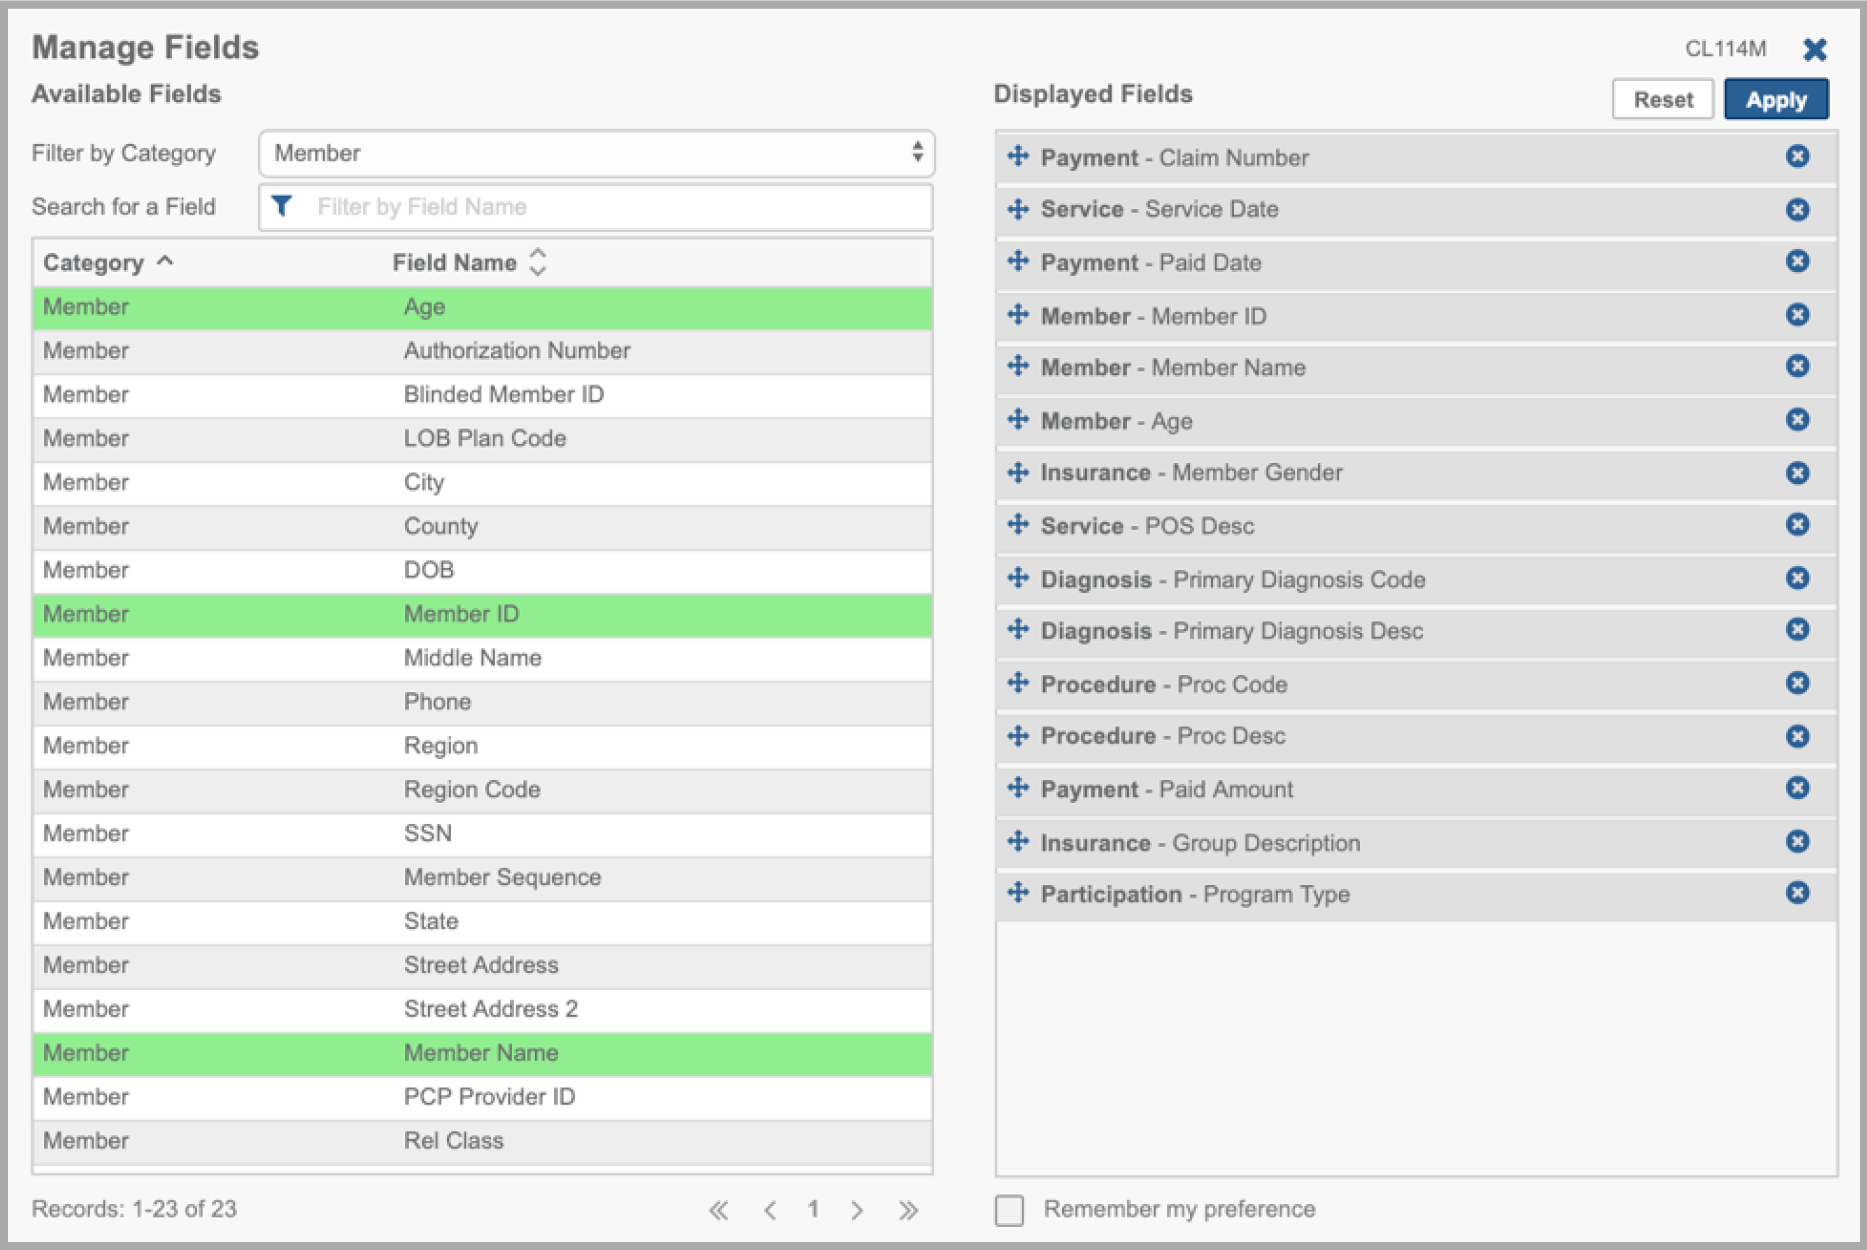
Within Plan Analytics, the “Show/Hide Fields” option opens a ‘Manage Fields’ window that allows you to select and reorder the columns that appear in your onscreen search results. In response to client feedback, we’ve updated this window to include a “Filter by Category” option to make it easier to view and navigate through the fields when selecting the columns you wish to display.
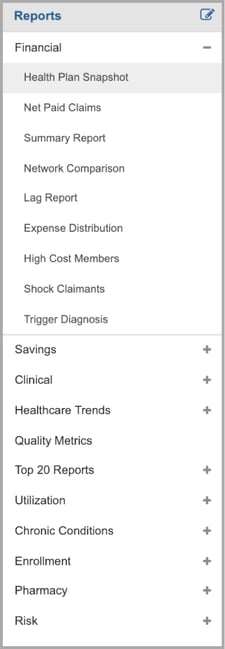
“Reports” Menu
The “Reports” menu displays a list of all available standard reports. With the number of reports increasing, we’ve reorganized this dropdown menu with sub-menus to make it more efficient to locate a specific report. All available reports are listed under a high-level category within the dropdown menu, which now includes a “Financial” reports category.
Looking ahead: In Plan Analytics version 8.5, Deerwalk will be releasing “Create Charts,” the second component of the custom report generation tool called the “Create” module. The “Create Charts” module will give clients the ability to add custom data visualizations on top of their custom reports.
Customers seeking more information on recent releases should contact their account managers.
To contact a Deerwalk representative to learn more about our healthcare reporting and analytics solutions or to schedule a demo, click the button below.

Click the button below to subscribe to blog updates.