

Traditional population health analytics vendors calculate utilization through the use of ‘summary tables’. This approach aggregates information from medical claims about a visit, service or procedure and stores that information in a slimmed down format (the summary table itself) that is digestible on lower performing SQL servers. Each utilization type has a summary table – an ER Visit summary table, an Admission summary table, a CT Scan summary table – and these summary tables, rather than the medical claims themselves, answer any and all questions about utilization rates and costs.
At Deerwalk, we take a different approach: creating a new data type – Utilization. Each record in our Utilization data describes a single occurrence of a visit, service or procedure and has 100+ fields containing information about the member, provider(s), insurance as well as the visit / service / procedure itself. One year of medical claims for a 5,000 employee data set might generate 100,000 Utilization records, and it is these records that would drive our answers to queries about that population's utilization rates and costs. It could be argued that we use summary tables too – just that our summary tables are much more detailed and an order of magnitude more numerous than those of traditional population health analytics vendors.
We’ll have the opportunity to look at the specific advantages of the Deerwalk model in future posts. For now, I just want to outline the overall benefits of our unique data-driven methodology:
- Our rules engine allows for greater precision and accuracy.
First of all, it’s worth noting that we look at more types of utilization than traditional vendors. Everyone’s going to show you numbers for ER Visits and Admissions, and some vendors might be able to scrape together usage rates for MRIs or CT Scans – but that’s likely to be just about all traditional vendors can offer. At Deerwalk the number of unique metrics is 20+ and counting.
Second, we’re able to get you closer to the real world usage count and real world cost than any method short of manually combing through survey data. We’re working at the level of individual events rather than summarizing into a handful of tables and that allows our logic to use a much finer grain. Each type of utilization event has its own logic for determining unique occurrences and its own logic for determining the all-in cost (e.g. across facility and provider, multiple providers, certain places of service, certain places of service in conjunction with specific diagnosis or procedure codes – you name it).
- Our logic is transparent and auditable within the application itself.
Traditional summary tables contain the bare minimum of information required to drive particular metrics and so “drilling down” into these summary tables isn’t particularly valuable. In our world however, you can drill down from the average cost of an ER visit in 2015 to a list of every single ER visit in 2015 and even further down from a particular ER visit to the individual claim lines. You can, in effect, follow the process in reverse from the aggregated metric value all the way back down the claim lines from the Medical feed.
One benefit of this level of detail is total transparency: Plan Analytics users can audit our utilization logic without ever leaving the application to the point of asking questions about the rationale for a single claim line being included or excluded from one office visit.
This transparency also allows for the continuous refinement of our utilization logic and rules engine. Traditional summary tables can’t ‘see’ down to the level of individual events and will fail to identify logical inaccuracies unless they are blatantly obvious at the summary level. We don’t have that problem: in fact, gaps in our logic are most often identified by looking at individual events.
If you care about data quality and about making sure that the analysis you present to your clients rests on solid, actionable foundations – this transparency is a big deal.
- Utilization data can answer more complex questions than traditional summary tables.
In limited contexts, the performance of summary table utilization counts is comparable to that of Deerwalk’s data-driven methods. Traditional vendors have been answering questions about Admissions and ER Visits for decades and will do a good job in most cases of giving accurate enough accounts of usage and average cost for those metrics.
The real issue is that summary table methods create what we call “anamorphic analysis” – analysis that only works if you view it from a certain angle. Summary tables can provide accurate enough estimations of the (very) big picture, but only if you know the question ahead of time. A new question requires a new summary table, and the system starts to fall apart really quickly when the questions get more complex.
Let’s use the following complex question as an example: what are the most common diagnoses driving members over 50 to incur ER Visits costing more than $5,000?
An ER summary table set isn’t going to be able to answer this question. The only information it’s likely to have is a tally of ER Visits and ER Dollars broken down by month and your levels of aggregation. A summary table capable of answering this question would have to be designed specifically to answer this question exactly as it’s phrased – which means that if you want to answer this question, you’re paying for custom development.
Data-driven methods make this question pretty simple to answer. Remember that Plan Analytics users have access to a database of all their ER visits and because those ER visit records have more than 100 query-able fields. Simply filter your ER records by Member Age and All-In Cost, then summarize by diagnosis. (You might also want to run the same summary analysis on unfiltered ER Visits so that you can separate commonly common diagnoses from those diagnoses that are disproportionately driving expensive ER visits in members 50+). The analysis can be done in real-time – in a couple of seconds, no more.
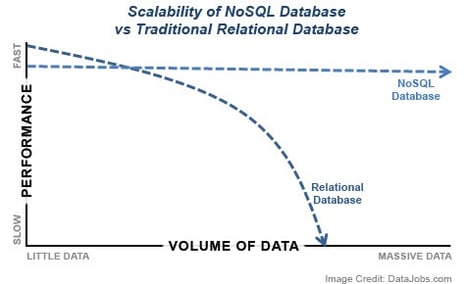
It’s ultimately a question of technology: traditional vendors have their hands tied by SQL environments that scale poorly and can’t be transitioned to distributed systems without expensive hardware. We’ve operated Plan Analytics in a distributed, NoSQL environment since day one - the same solution to handling some of the biggest data warehouses on the planet – the likes of Google, Facebook, Amazon, and the CIA. And crucially, this decision has paid off in spades, not only in the cost-efficiency and speed of our products, but also the accuracy and comprehensiveness of the analysis our products provide.
To learn more about Deerwalk's Population Health Analytics solutions, including Deerwalk Data Integrator, please visit us at Deerwalk.