
Deerwalk's latest release of Plan Analytics includes new chart creation functionality and modifications to the "Report Archive"
Thanks to the hard work of our engineers, we are proud to announce that version 8.5 of Plan Analytics, the flagship population health analytics and reporting application, is now available! Along with making some modifications to the "Report Archive," we've added a new component to the "Create" module, which, in addition to Template Manager, gives you the ability to generate your own custom reports.
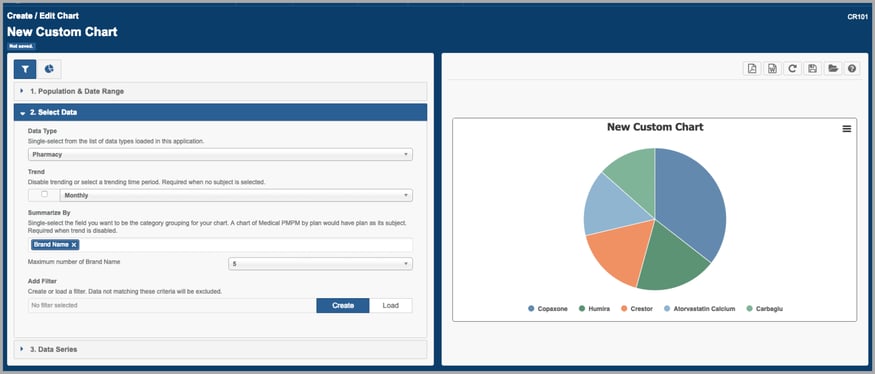
NEW! "Create Charts" is the second component of our custom report generation tool (the “Create” module). The first component, "Create Tables" was released in version 8.2 (read more on Create Tables). With "Create Charts" you can build, save, and export a variety of data visualizations with the same, easy-to-use summarization functionality found in "Create Tables." There are options to summarize by different fields, add filters, trend data, and view the results through a variety of metrics such as "Sum," "Per 1000," and "PMPM." Just like "Create Tables," these charts can be published in real-time and bundled and scheduled in reporting packages for easy distribution.
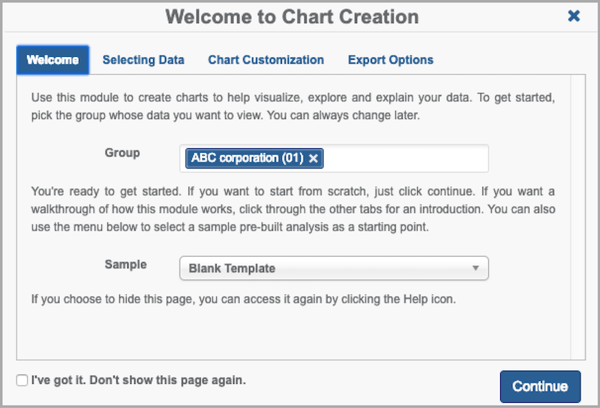
- An embedded "Help Guide" gets you started with instructions to walk you through the chart creation process and provides sample charts for reference.
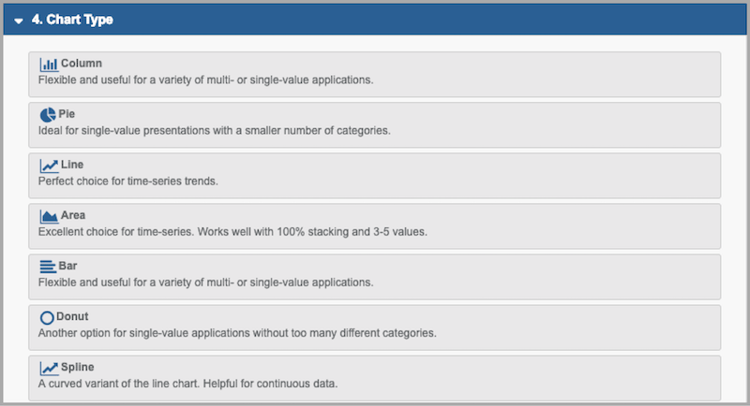
- A number of different chart types are available (see below). Each chart type contains customizable elements such as title, axis labels, data labels, and legends. If you have enabled custom branding, these branding preferences will be visible as well (read more on branding).
ENHANCEMENT! Updates to the "Report Archive" now allow you to download reports or data in bulk (the downloaded files will be placed in a zip folder). This update is particularly useful if your workflow involves managing large quantities of scheduled reports that are generated on a single day.
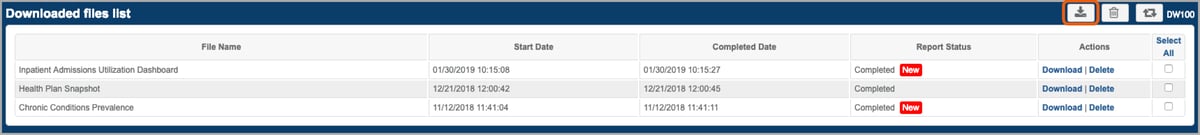
- A new “In Queue,” status allows you to track the progress of reports in the "Report Archive." This status indicates that the report has yet to begin processing as it is awaiting available export resources.

Looking ahead: In version 8.6, Deerwalk will conduct our annual quality metrics update and increase the compatibility of quality metrics with lab data.
Customers seeking more information on recent releases should contact their account managers.
Schedule a demo to learn more about how to use Deerwalk Plan Analytics and the latest features.

Subscribe to our blog or follow us on Facebook, Twitter or LinkedIn to join the conversation.